The human cost of inequality

IMG_3932by Tessa Coombes, guest blogger for P&P conference 2015

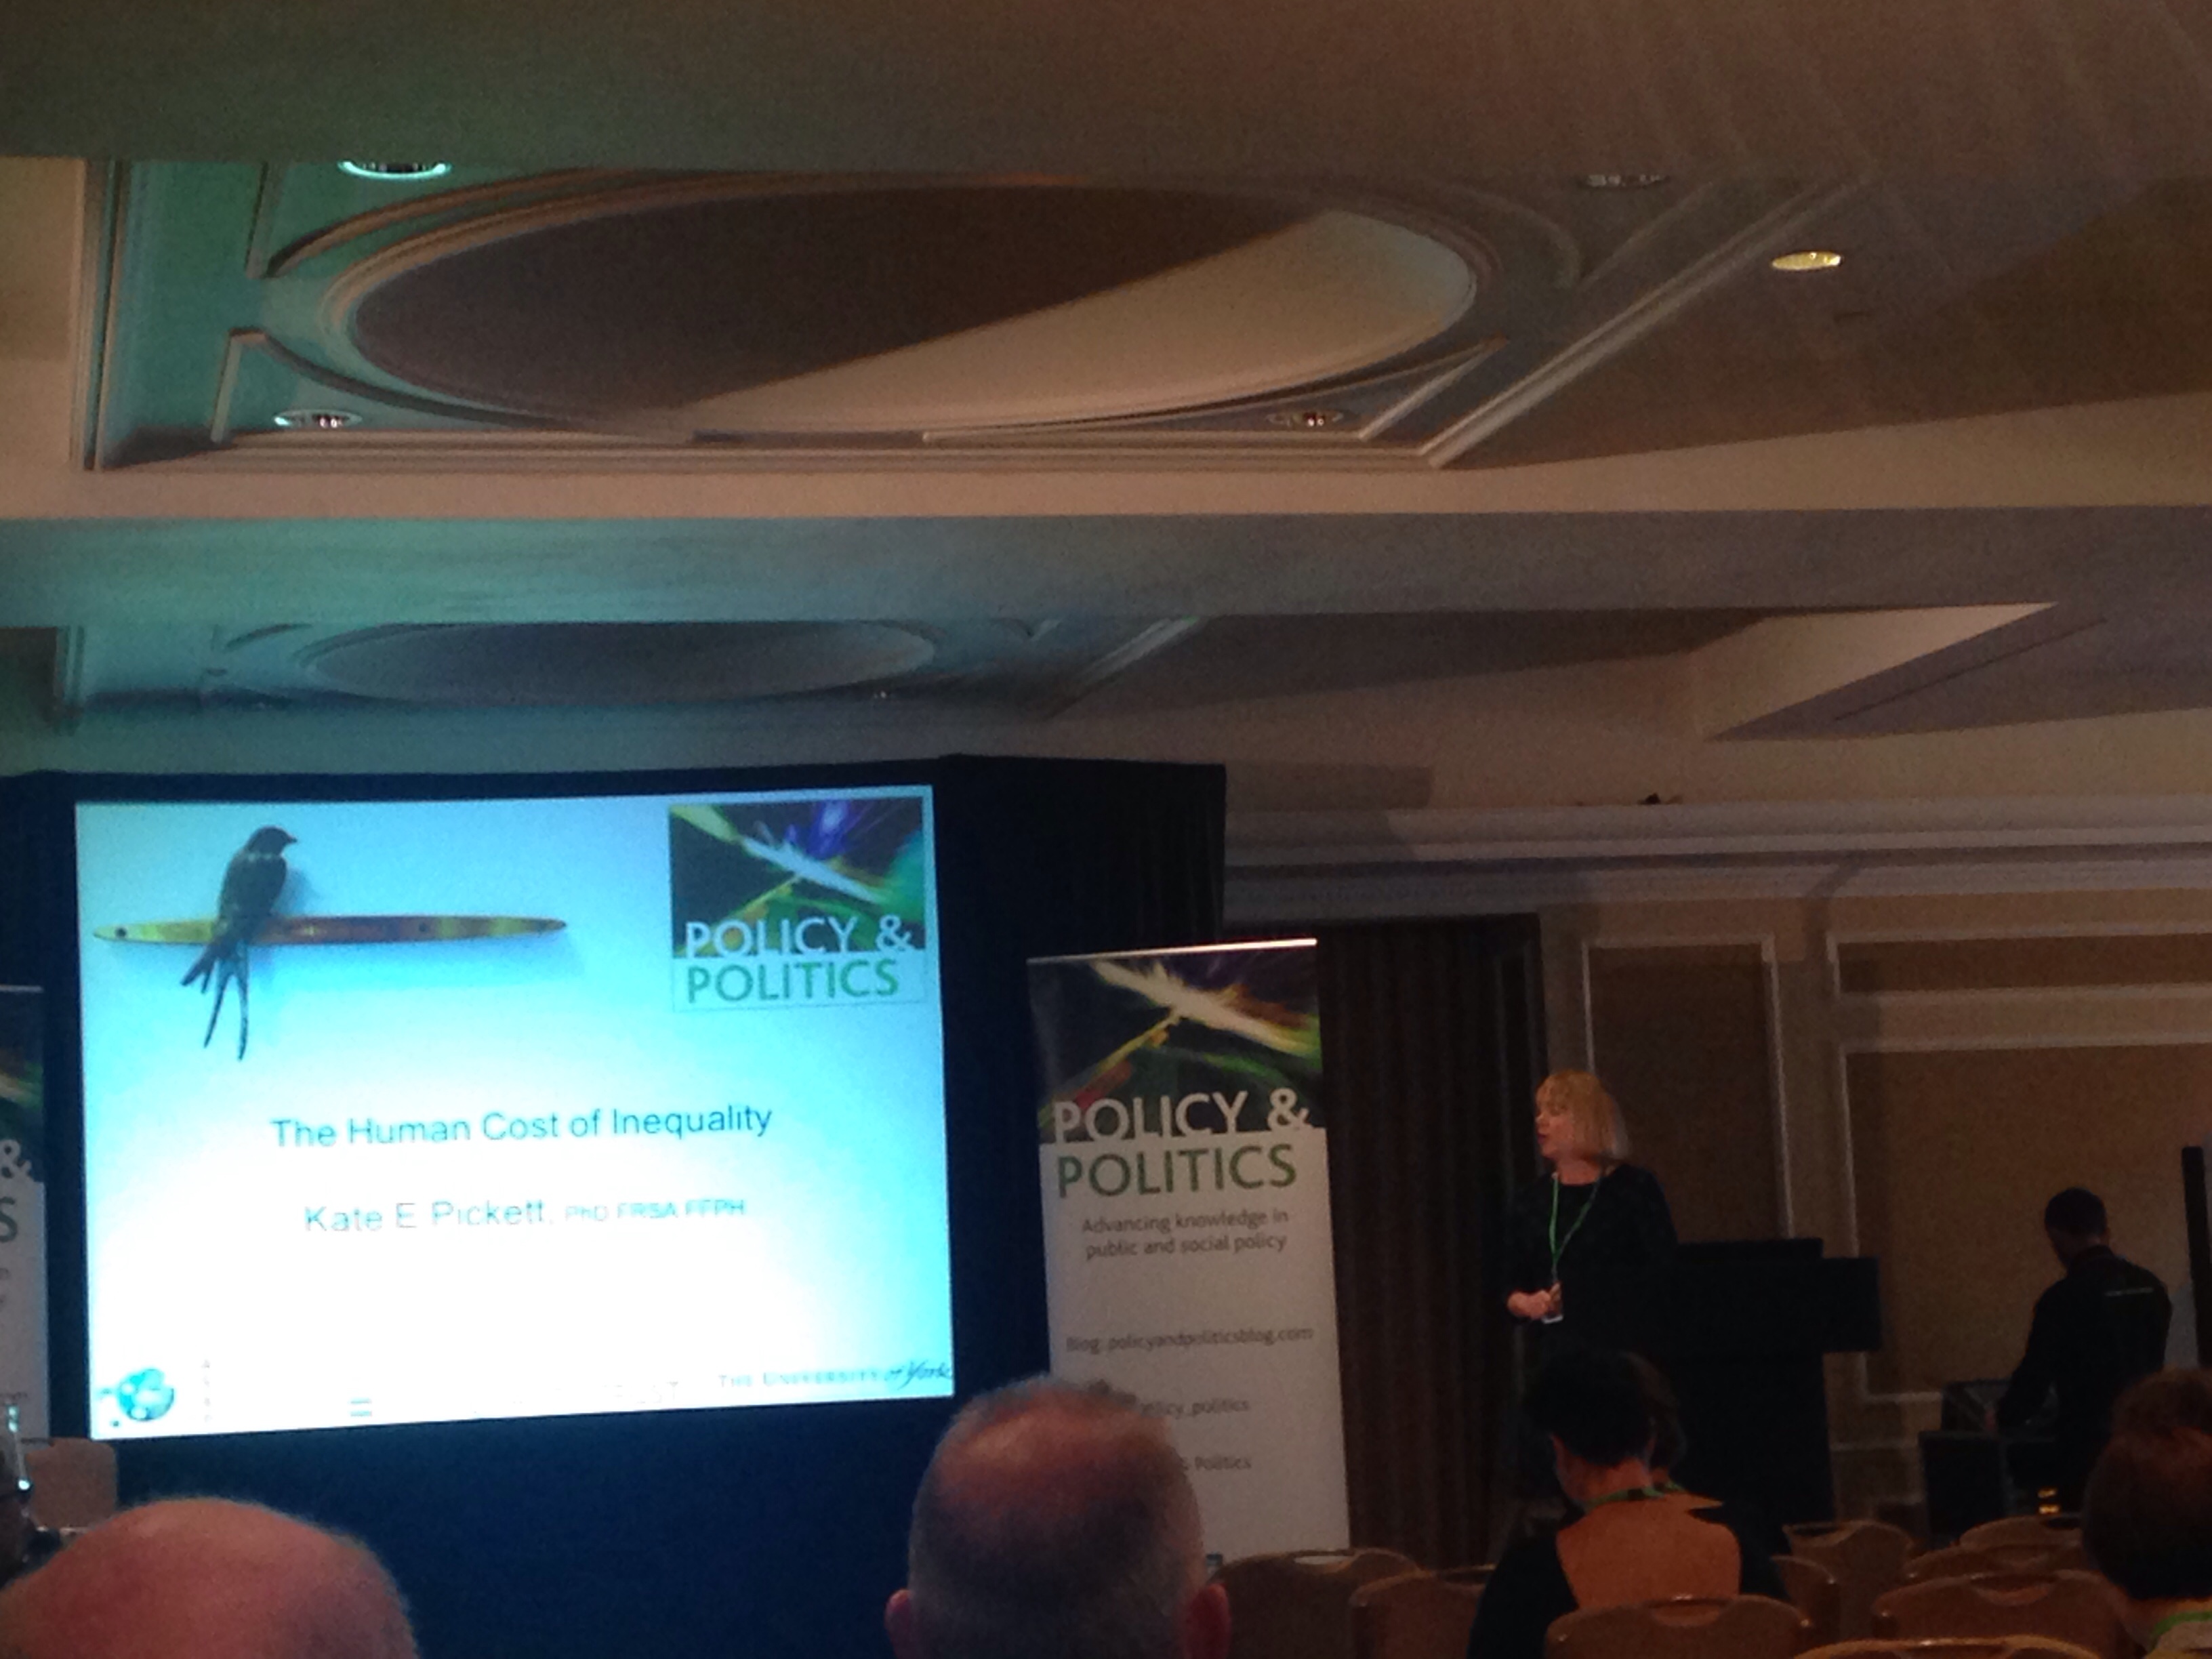
The second day of the conference started with an excellent presentation from Prof. Kate Pickett, from the University of York. Kate co-authored the influential book “The Spirit Level” which provided evidence to illustrate how almost everything is affected not by how wealthy a society is but how equal it is. The book was written at a time when inequality was not being discussed, and even now, whilst it is indeed the subject of much more debate on an international stage, it is still only rhetoric, and we are still waiting for this to translate into real action.

There are some shocking statistics that illustrate the level of the challenge we face across the globe, such as the one used by Oxfam – the 85 richest people on the planet have the same wealth as 3.5 billion of the poorest people – illustrating a truly grotesque level of inequality. But, as Kate pointed out, we need to remember that these are not just meaningless, abstract numbers, they represent real human suffering and have real impacts. Continue reading

Why social inequality persists

IMG_3926by Tessa Coombes, guest blogger for P&P Conference 2015.

The second plenary session of the Policy and Politics Annual Conference was delivered by Prof. Danny Dorling, who provided a shocking and somewhat scary analysis of the increasing levels of inequality in the UK. The big question for us all to consider is why there is no consistent challenge to this situation and why we appear to accept the disparities that exist. Why is it acceptable and why would anyone think inequalities are a good thing?

One answer to the question is that we don’t actually realise how unequal we are as a society. But a quick look through some of the statistics soon provides the evidence we need. Danny took us through graph after graph that more than adequately demonstrated just how big the problem is and that it is increasing. One example to illustrate the point, in 2010 the best off tenth of the population in the UK were nearly 14 times better off than the worst off tenth. By 2015 this had grown to more than 17 times better off, and if the trend continues on a similar course in less than 20 years the best off will have over 24 times as much disposable income as the worst off. The problem is that the change is gradual, we don’t notice it so much and we get Continue reading